How to Set Up Real-Time Log Monitoring with Grafana, Loki, and Promtail
Hi and welcome! I've been wanting to build a solution that allows me to collect logs from my proxmox servers to detect specific events, such as when a backup starts or completes, when a Docker container crashes, authentication errors, etc. The goal is to get a notification when a specific log event happens.
After a bit of googling and experimenting, I landed on a lightweight but powerful setup using Grafana and Loki, all orchestrated with help from AI. What really surprised me was how quickly it came together ~ what would normally take a few days was done in just a few hours.
Best of all, every tool used in this solution is open source, which was one of key reasons for going down this route. I had previously tested the ELK stack (Elasticsearch, Logstash, and Kibana), but unfortunately, features like alerting are locked behind a paid tier.. something I wanted to avoid.
Right now, this solution captures the follows the below events. I've taken some screenshots below to show some of the visualisations.
- SSH Login Attempts
- System Logs
- Docker Container logs
- Kernal Logs
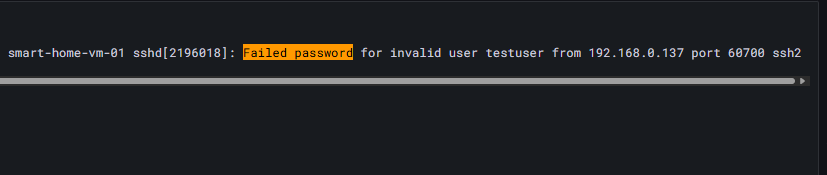

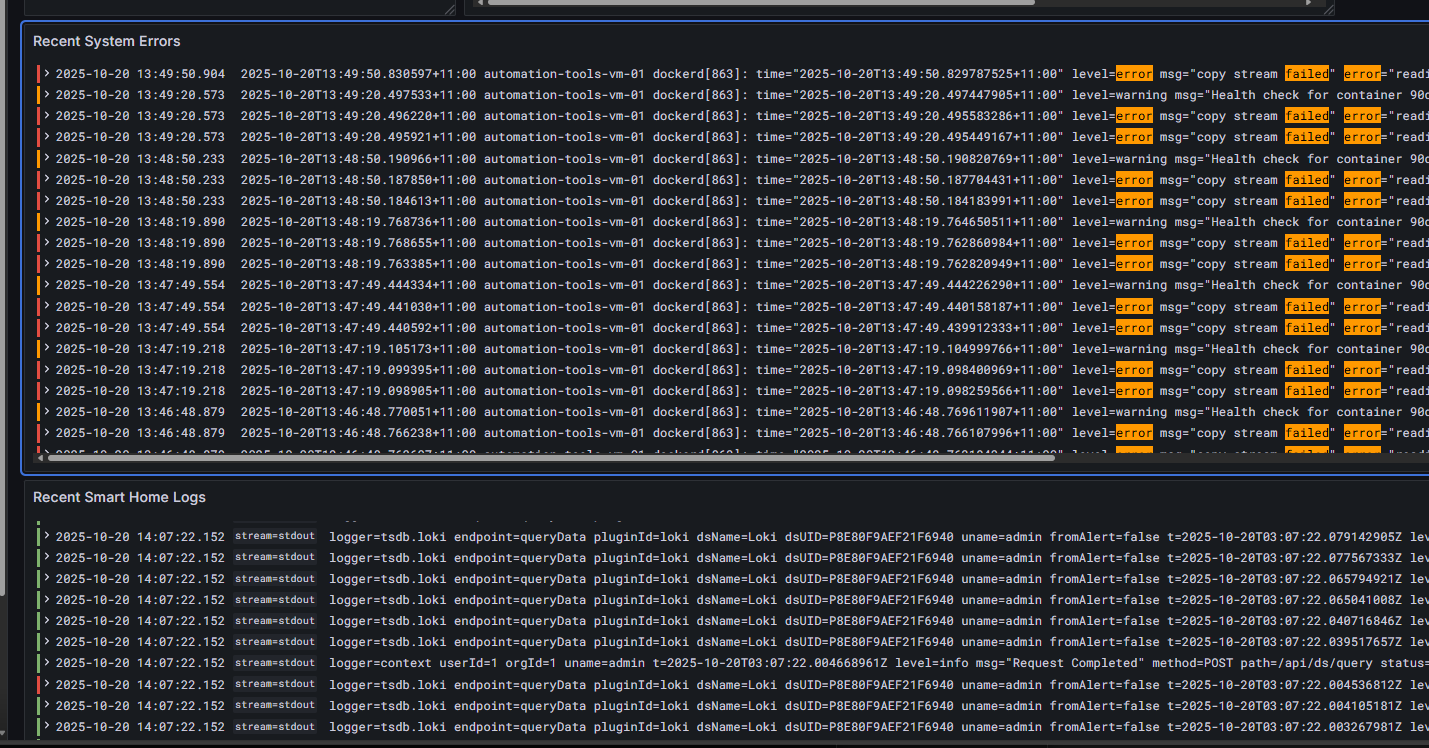
So without further ado, let's dive in and walk through the setup.
Prerequisites
Before you start, make sure you have:
- Docker CLI installed (for running containers)
- Docker Compose (for managing multi-container setups)
- Ubuntu 20.04+ or a similar Linux distribution on the servers you want to monitor
Architecture Overview
The log monitoring stack follows a hub-and-spoke architecture. The solution combines industry-standard open-source tools:
- Grafana for visualization and dashboards
- Loki for log aggregation and analysis
- Promtail for log shipping
┌─────────────────────────────────────────────────────────────┐
│                    LOG MONITORING SERVER                   │
│  ┌─────────────┐ ┌─────────────────────┐                   │
│  │   Grafana   │ │        Loki         │                   │
│  │    :3000    │ │       :3100         │                   │
│  └─────────────┘ └─────────────────────┘                   │
│  ┌─────────────────────┐                                   │
│  │      Promtail       │                                   │
│  │    (log shipper)    │                                   │
│  └─────────────────────┘                                   │
└─────────────────────────────────────────────────────────────┘
                              │
                              │ Network
                              │
┌─────────────────────────────────────────────────────────────┐
│                    REMOTE SERVERS                          │
│  ┌─────────────────────┐                                   │
│  │      Promtail       │                                   │
│  │    (log shipper)    │                                   │
│  └─────────────────────┘                                   │
└─────────────────────────────────────────────────────────────┘
Data Flow
- Log Aggregation: Promtail ships logs from my Ubuntu servers to Loki
- Visualization: Grafana queries Loki for log dashboards and analysis
- Alerting: Grafana evaluates log-based rules and sends alerts via configured channels
The deployment structure includes:
├── deploy-remote.sh
├── docker-compose-remote.yml
├── docker-compose.yml
├── grafana\
│   └── provisioning\
│       ├── alerting\
│       ├── dashboards\
│       └── datasources\
├── loki\
│   └── local-config.yaml
└── promtail\
    └── config.yml
Step-by-Step Implementation
Deploy the Monitoring Stack (Grafana)
First, let's clone the repo. This contains all the files included to deploy the solution stack
Clone the repo with the below command
# Download the complete log monitoring solution
git clone https://github.com/phipcode/phiptechblog/tree/main/monitoring/monitor-stack
cd monitoring/monitor-stack
Configure Loki Config
Next, configure loki config file under the Loki Directory. You can of course leave this as default. This was generated with AI, so I've left all settings as default.
Loki configuration (loki/local-config.yml) handles log storage and retention.
auth_enabled: false

server:
  http_listen_port: 3100
  grpc_listen_port: 9096

common:
  path_prefix: /loki
  storage:
    filesystem:
      chunks_directory: /loki/chunks
      rules_directory: /loki/rules
  replication_factor: 1
  ring:
    instance_addr: 127.0.0.1
    kvstore:
      store: inmemory

query_range:
  results_cache:
    cache:
      embedded_cache:
        enabled: true
        max_size_mb: 100

schema_config:
  configs:
    - from: 2020-10-24
      store: boltdb-shipper
      object_store: filesystem
      schema: v11
      index:
        prefix: index_
        period: 24h

ruler:
  storage:
    type: local
    local:
      directory: /loki/rules
  rule_path: /loki/rules
  ring:
    kvstore:
      store: inmemory
  enable_api: true

limits_config:
  reject_old_samples: true
  reject_old_samples_max_age: 168h
  retention_period: 744h  # 31 days
Configure Promtail Config
This is where the magic happens. The Promtail configuration file defines how your logs are collected, parsed, and labeled before being sent to Loki.
Each job in the file contains the regex patterns, labels, and configuration settings for capturing the right data.
You can start with the default configuration, but you’ll likely want to update the target IP address. For example, set it to localhost or to the specific server you want Promtail to monitor.
Below is a snippet of the Promtail configuration.
I’ve added labels for the hostname, so you’ll want to update those to match your environment.
Tip: There’s also a script included to automate creating this Promtail config. Keep reading until the end to see how it works.
server:
  http_listen_port: 9080
  grpc_listen_port: 0

positions:
  filename: /tmp/positions.yaml

clients:
  - url: http://192.168.0.137:3100/loki/api/v1/push

scrape_configs:
  # System logs with enhanced parsing (excluding auth.log and kern.log)
  - job_name: system
    static_configs:
      - targets:
          - localhost
        labels:
          job: varlogs
          hostname: "smart-home-vm-01"
          server_type: "smart-home"
          __path__: /var/log/{syslog,messages,daemon.log,user.log,mail.log,cron.log,debug,alternatives.log,dpkg.log,bootstrap.log,cloud-init.log,cloud-init-output.log,apport.log,fontconfig.log}
    pipeline_stages:
Configure Docker Compose Config
Next, modify the Docker Compose file. You can leave most settings as default for now.
This setup will deploy Grafana, Loki, and Promtail on the same server.
Update the hostname if needed to match your environment.
By default:
- Grafana will be accessible on port 5000
- Loki will be available on port 3200
services:
  grafana:
    image: grafana/grafana:latest
    container_name: grafana
    ports:
      - 5000:3000
    restart: unless-stopped
    volumes:
      - grafana_data:/var/lib/grafana
      - ./grafana:/etc/grafana/provisioning/datasources
    networks:
      - monitoring
    healthcheck:
      test: ["CMD-SHELL", "wget --spider --quiet http://localhost:5000 || exit 1"]
      interval: 30s
      timeout: 5s
      retries: 3
    logging:
      options:
        max-size: "10m"
        max-file: "3"

  loki:
    image: grafana/loki:latest
    container_name: loki
    ports:
      - 3200:3100
    restart: unless-stopped
    volumes:
      - ./loki:/etc/loki
      - loki_data:/loki
    networks:
      - monitoring
    command: -config.file=/etc/loki/local-config.yaml
    healthcheck:
      test: ["CMD-SHELL", "wget --spider --quiet http://localhost:3100/ready || exit 1"]
      interval: 30s
      timeout: 5s
      retries: 3
    logging:
      options:
        max-size: "10m"
        max-file: "3"

  promtail:
    image: grafana/promtail:latest
    container_name: promtail
    restart: unless-stopped
    volumes:
      - ./promtail:/etc/promtail
      - /var/log:/var/log:ro
      - /var/lib/docker/containers:/var/lib/docker/containers:ro
    networks:
      - monitoring
    environment:
      - HOSTNAME=smart-home-vm-01
      - SERVER_TYPE=smart-home

    command: -config.file=/etc/promtail/config.yml
    depends_on:
      - loki

volumes:
  grafana_data:
  loki_data:

networks:
  monitoring:
Dashboards
The solution comes with a pre-built dashboard, so you don’t have to start from scratch. Of course, you can customize and tweak it to suit your needs.
You can find and modify the dashboard in the project directory - just edit the files as needed to adjust the layout, metrics, or visualizations.
Deploy the Stack
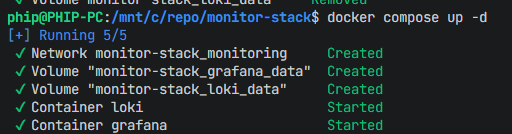
Great! Now it’s time to bring your monitoring stack online. Run the following commands to start everything up:
# Start all services
docker compose up -d

# Verify deployment status
docker compose ps

# View logs in real-time
docker compose logs -f
Access the Dashboard
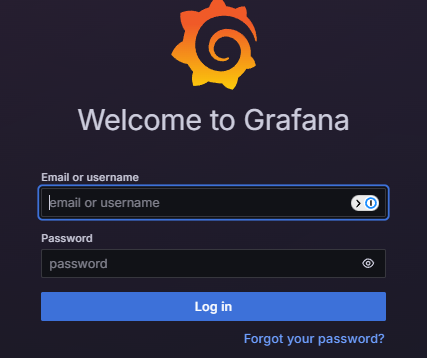
- Grafana: http://your-server-ip:3000 (admin/admin)
- Log into Grafana and change your password
- Default user & pass: admin

- Loki: http://your-server-ip:3200
- Confirm datasource has been added under Data sources in Grana

Phase 2: Remote Server Configuration - Deploy promtail servers to monitor (Optional)
This step is only required if you want to monitor additional servers beyond the main host.
1. Automated Deployment
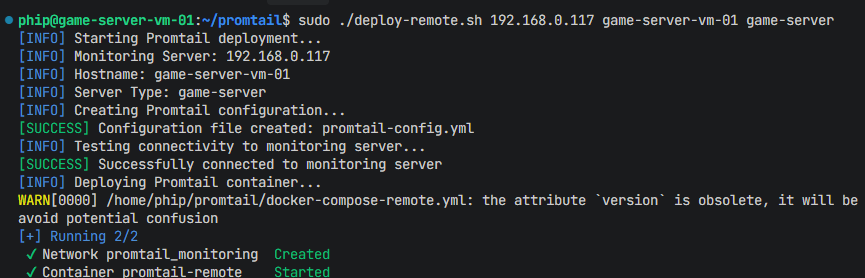
For each remote server, use the provided deployment script to automatically install and configure Promtail.
# Run automated deployment
Usage: <monitoring_server_ip> <hostname> <server_type>"
Example: 192.168.1.100 web-server-01 web"
./deploy-remote.sh 192.168.0.197 automation-tools-vm-01 proxmox
The script will:
- Configure Promtail config with correct server details
- Deploy Promtail container
- Test connectivity to monitoring server
- Start collecting logs

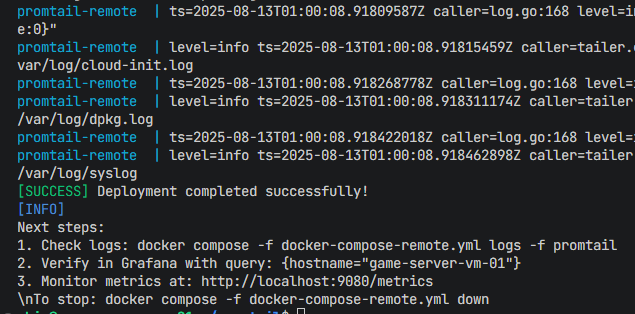
Navigate to Dashboards via Grafana and you will it added. If you don't see this, check the docker logs to troubleshoot

Congratualations, you've successfully onboarded a server to monitor.
What's Next?
Now that your log monitoring stack is up and running, here are some things you can do to make it even better:
- Add more servers if you want to monitor multiple machines, using the Promtail deployment scripts.
- Check your logs in Grafana to make sure everything is coming through correctly.
- Tweak your dashboards so you can see the metrics and logs that matter most for your apps.
- Set up alerts in Grafana or Loki so you get notified about issues before they turn into problems.
- Hook up notifications with Slack, Teams, or email to stay on top of things in real time.
- Back up your configs and logs regularly so you don’t lose any important data.
Found this article useful? Why not buy Phi a coffee to show your appreciation?